Enhance SaaS Dashboards with Dynamic Diagrams Using Mermaid.js
Learn how to integrate Mermaid.js into your SaaS applications to create dynamic, maintainable diagrams. Explore real-time rendering techniques and diagram types like flowcharts and Gantt charts to improve user experience.

Zakariae
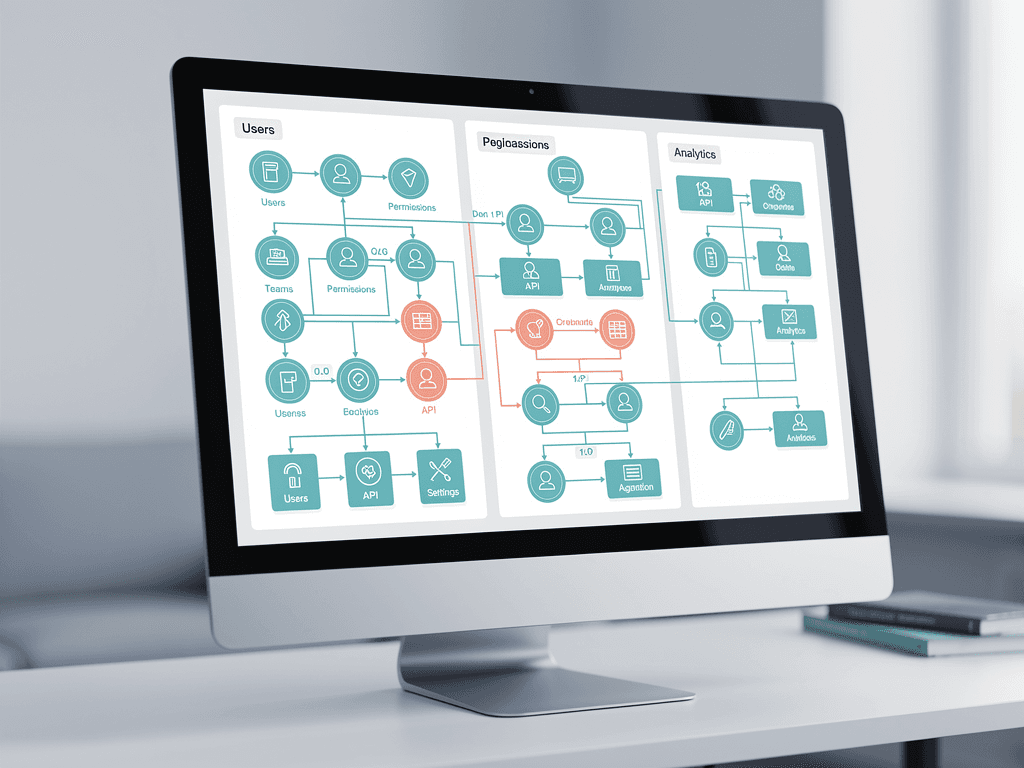
Modern SaaS applications demand more than static interfaces and text-heavy dashboards. Today's users expect visual representations of complex data, workflows, and system architectures that help them understand information at a glance. Whether you're building an admin panel for subscription management, visualizing user journeys, or documenting API flows, the ability to render dynamic diagrams directly within your application has become a competitive differentiator. This is where JavaScript-based diagramming tools transform how developers approach data visualization in their products.
For SaaS founders and full-stack developers working with modern frameworks, integrating powerful visualization capabilities doesn't require expensive third-party services or complex drawing libraries. Mermaid.js offers a remarkably elegant solution: define diagrams using simple, Markdown-inspired text syntax, and let the library handle the rendering. This approach makes diagrams as maintainable as code, as updatable as configuration files, and as dynamic as your application's data. In this comprehensive guide, we'll explore how to leverage this powerful tool within your SaaS admin dashboards, covering everything from basic integration to advanced real-time rendering techniques.
Key Takeaways
- Text-based diagram definitions make visualizations version-controllable, easily maintainable, and dynamically generatable from application data
- Mermaid supports multiple diagram types including flowcharts, sequence diagrams, Gantt charts, entity relationship diagrams, and state diagrams, covering most SaaS visualization needs
- Integration with React and Next.js requires careful handling of client-side rendering due to DOM manipulation requirements
- Dynamic diagram generation allows you to visualize real-time subscription flows, user journeys, and system architectures based on live data
- Performance optimization through lazy loading and caching ensures diagrams don't impact dashboard responsiveness
- Theming capabilities enable seamless integration with your application's design system, including dark mode support
- Security considerations are essential when rendering user-generated or dynamic content to prevent XSS vulnerabilities
Understanding the Power of Text-Based Diagrams
Traditional diagramming approaches require graphical editors, proprietary file formats, and manual updates whenever underlying systems change. This creates a significant maintenance burden for SaaS teams who need to keep documentation and visualizations synchronized with rapidly evolving codebases. The fundamental problem isn't creating diagrams; it's keeping them accurate over time without dedicating excessive resources to the task.
Text-based diagramming flips this paradigm entirely. Instead of manipulating shapes and arrows in a visual editor, developers define diagram structure using a declarative syntax. This approach offers several compelling advantages for SaaS applications. First, diagrams become version-controllable alongside your code, enabling meaningful diffs and collaborative reviews. Second, the text definitions can be generated programmatically from application state, database schemas, or API responses. Third, updates become trivially easy since changing a diagram requires editing text rather than repositioning visual elements.
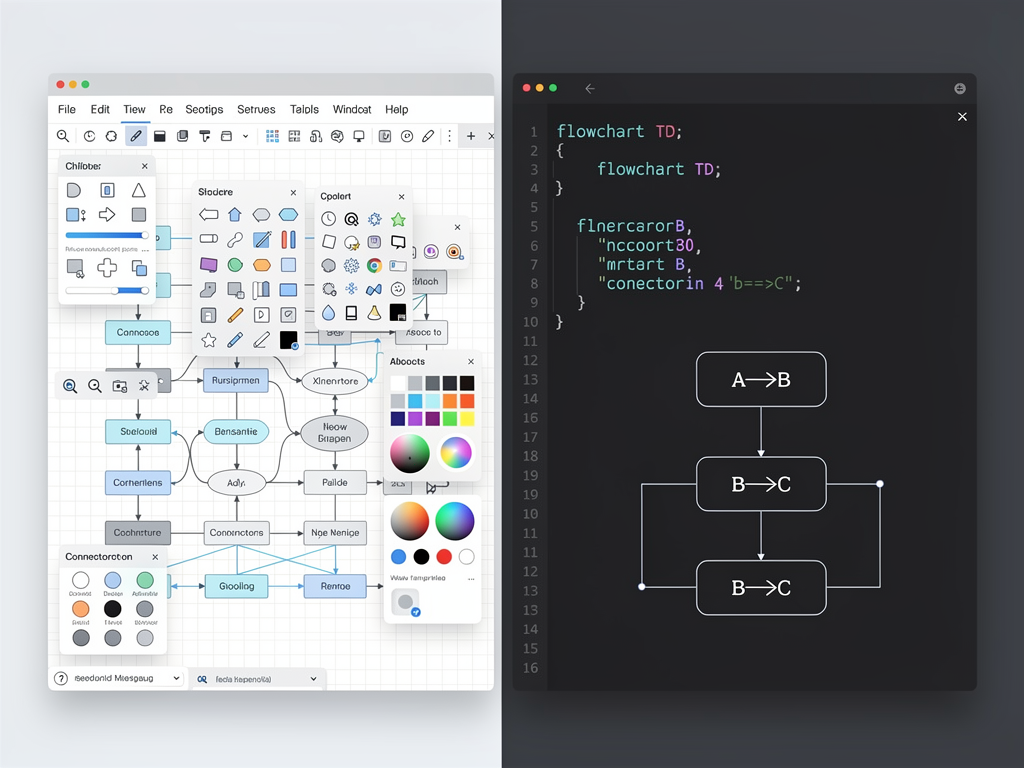
Consider a practical example: your SaaS application needs to display the subscription upgrade flow to administrators. With traditional tools, a designer creates a flowchart, exports it as an image, and a developer embeds it in the dashboard. When the product team adds a new subscription tier, someone must locate the original file, modify it, re-export, and update the embedded image. With text-based diagrams, the flow definition lives in your codebase or database, updates happen through normal development workflows, and the diagram renders automatically with current information.
The mermaid js library has emerged as the leading solution in this space, offering broad diagram type support, active maintenance, and excellent documentation. Its Markdown-inspired syntax feels natural to developers already comfortable with documentation tools, and its rendering engine produces professional-quality SVG output suitable for production applications.
Core Diagram Types for SaaS Dashboards
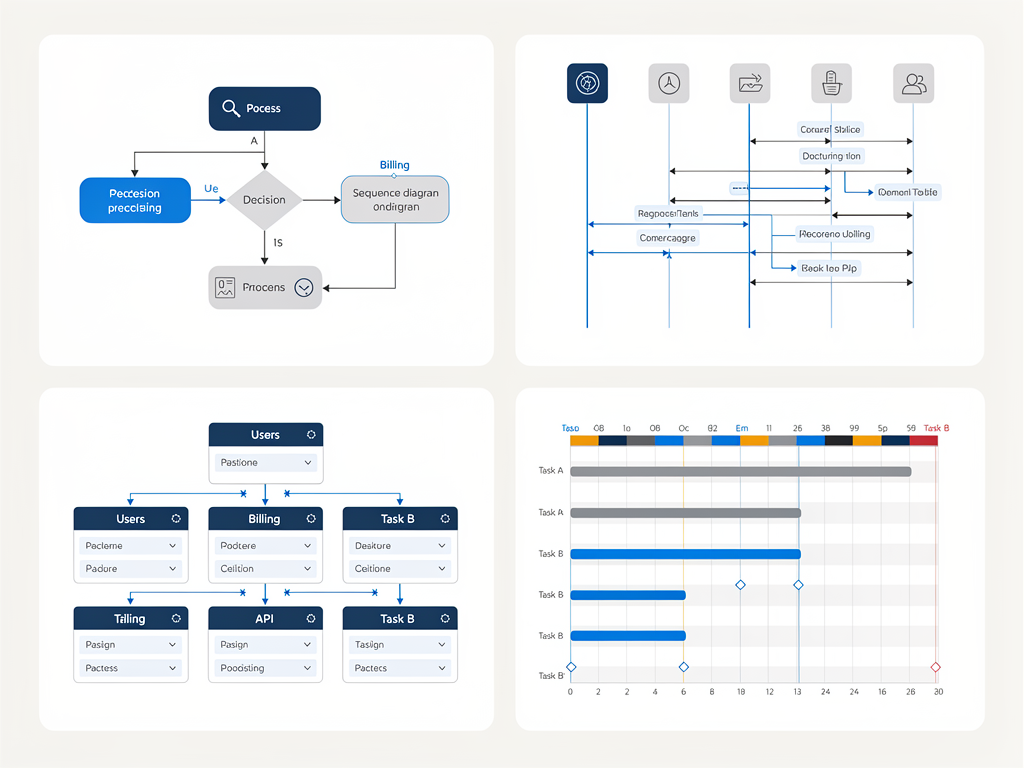
Before diving into implementation details, understanding which diagram types best serve different SaaS visualization needs helps you plan your integration strategy. Mermaid supports an impressive range of diagram types, each suited to specific use cases within admin dashboards and user-facing interfaces.
Flowcharts for Process Visualization
Flowcharts represent the most versatile diagram type for SaaS applications. They excel at visualizing user onboarding flows, payment processing sequences, feature flag decision trees, and administrative approval workflows. The syntax supports various node shapes (rectangles, diamonds, circles), connection types (solid, dotted, thick), and directional layouts (top-down, left-right).
A typical flowchart definition for a subscription upgrade process might include decision points for payment validation, conditional paths for different subscription tiers, and terminal nodes for success or failure states. Administrators viewing this diagram immediately understand the system's behavior without reading through code or documentation.
Sequence Diagrams for API and Integration Flows
Sequence diagrams prove invaluable for visualizing interactions between system components, third-party integrations, and user sessions. In a SaaS context, they help administrators understand webhook delivery sequences, OAuth authentication flows, and multi-service data synchronization processes. The temporal nature of sequence diagrams makes them particularly effective for debugging integration issues or explaining system behavior to non-technical stakeholders.
Entity Relationship Diagrams for Data Architecture
For SaaS applications with complex data models, entity relationship diagrams help administrators and developers understand how different entities connect. Visualizing relationships between users, organizations, subscriptions, invoices, and feature entitlements provides clarity that database schemas alone cannot offer. These diagrams become especially valuable during onboarding new team members or planning schema migrations.
Gantt Charts for Project and Timeline Visualization
If your SaaS product involves project management, task scheduling, or timeline-based features, Gantt chart support enables rich visualizations without additional libraries. Subscription billing cycles, trial period timelines, and feature rollout schedules all benefit from Gantt-style presentation within admin dashboards.
State Diagrams for Lifecycle Management
Subscription states, user account statuses, and order fulfillment stages all follow state machine patterns. State diagrams visualize these lifecycles clearly, showing valid transitions and terminal states. For SaaS administrators troubleshooting why a subscription appears stuck or investigating account status issues, state diagrams provide immediate context.
Setting Up Mermaid in Your Next.js Application
Integrating Mermaid into a modern Next.js application requires understanding the library's browser-dependent nature. Since Mermaid manipulates the DOM directly to render SVG diagrams, it cannot execute during server-side rendering. This constraint shapes your implementation approach, particularly when working with a Next.js boilerplate or SaaS template that emphasizes server components.
Begin by installing the library through your preferred package manager. The core package provides everything needed for basic diagram rendering, though additional packages exist for specific integrations and editor support.
Installation Tip: Always pin your Mermaid version in production applications. The library occasionally introduces breaking changes to diagram syntax or rendering behavior between major versions, and unexpected updates can break existing diagrams in your application.
The initialization process involves configuring global settings that affect all diagrams rendered in your application. Key configuration options include the default theme (light, dark, forest, or neutral), security level for handling potentially untrusted content, and font family settings for consistent typography. For SaaS applications supporting dark mode, the theme configuration becomes particularly important since diagrams must adapt to user preferences.
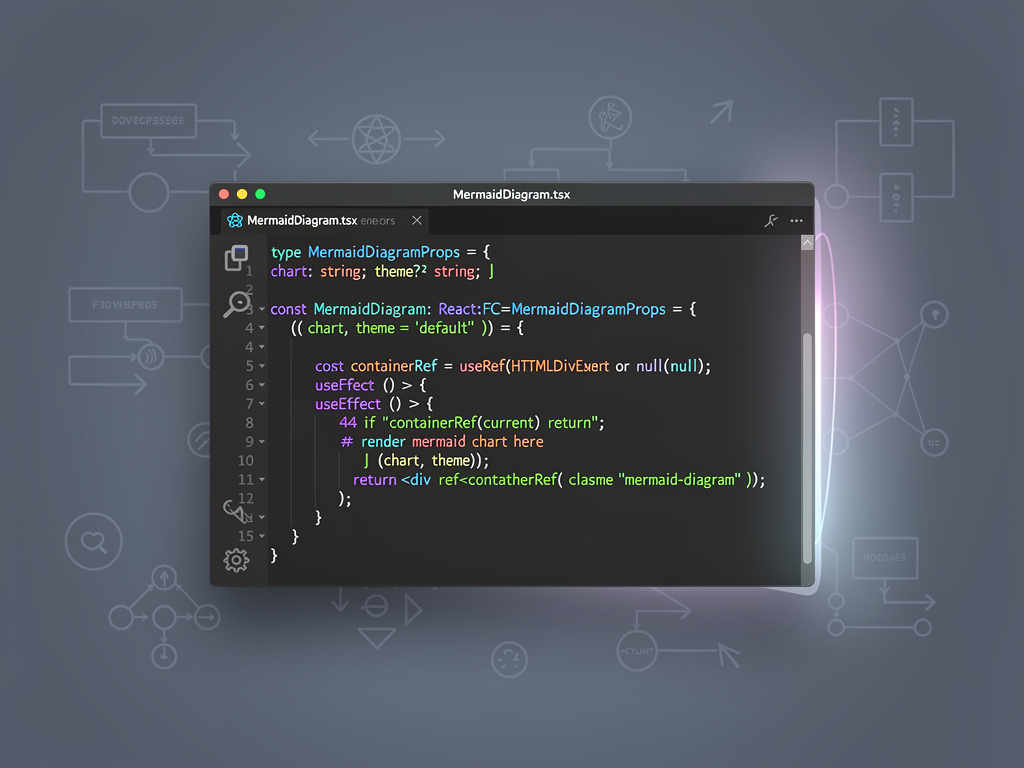
Create a dedicated component that handles Mermaid initialization and rendering. This component should use the useEffect hook to ensure Mermaid only initializes on the client side, preventing hydration mismatches and server-side errors. The component accepts diagram definitions as props and manages the rendering lifecycle, including cleanup when definitions change.
| Configuration Option | Purpose | Recommended Value for SaaS |
|---|---|---|
| securityLevel | Controls how untrusted content is handled | 'strict' for user-generated content |
| theme | Sets the visual appearance | 'default' or dynamic based on user preference |
| startOnLoad | Auto-renders diagrams on page load | false (manual control preferred) |
| fontFamily | Typography for diagram text | Match your application's font stack |
| logLevel | Console output verbosity | 'error' in production, 'debug' in development |
Building a Reusable Diagram Component
A well-architected diagram component serves as the foundation for all Mermaid usage throughout your SaaS application. Rather than initializing Mermaid in multiple places, centralizing the logic ensures consistent behavior, simplifies maintenance, and enables application-wide optimizations.
The component should accept several props to maximize flexibility. The diagram definition string represents the core input, but additional props for custom styling, error handling callbacks, and loading states enhance the developer experience. Consider implementing a unique identifier system for each diagram instance, as Mermaid requires distinct IDs when multiple diagrams appear on the same page.
Error handling deserves particular attention in production applications. Invalid diagram syntax, rendering failures, and initialization errors should all be caught and handled gracefully. Displaying a fallback UI with error details helps administrators understand when diagrams fail to render, while logging errors to your monitoring system enables proactive issue detection.
For applications built on a SaaS starter kit or similar foundation, integrating the diagram component with existing patterns for loading states, error boundaries, and theming ensures visual consistency. The component should respect your design system's spacing, border radius, and shadow conventions to feel native within the dashboard interface.
Consider implementing a caching layer for rendered diagrams, particularly when the same definition might render multiple times during a user session. Mermaid's rendering process, while fast, involves parsing and SVG generation that can be avoided for unchanged definitions. A simple memoization strategy based on definition hash significantly improves perceived performance.
Dynamic Diagram Generation from Application Data
Static diagrams provide value, but the true power of text-based diagramming emerges when generating definitions dynamically from your application's data. This capability transforms diagrams from documentation artifacts into live visualizations that always reflect current system state.
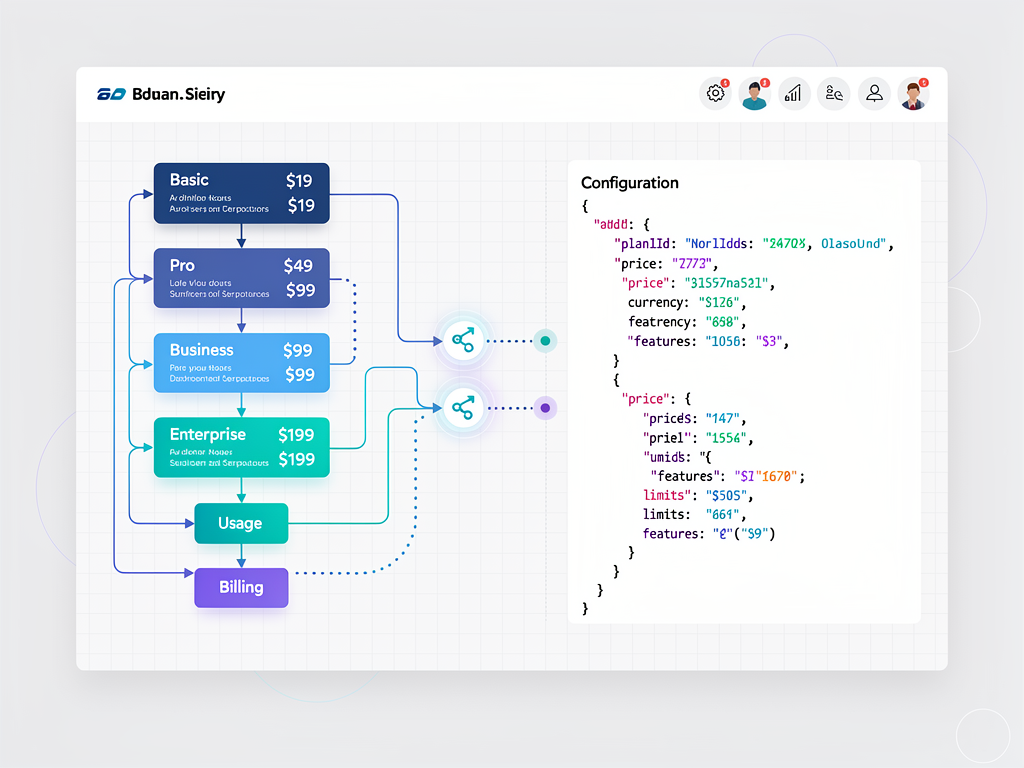
Consider a subscription management dashboard where administrators need to understand how different pricing tiers relate to features. Rather than maintaining a static diagram, you can generate the flowchart definition from your pricing configuration. When product managers add new tiers or modify feature entitlements, the diagram updates automatically without developer intervention.
The implementation pattern involves creating generator functions that accept data structures and return valid Mermaid syntax strings. These functions must handle edge cases like empty data sets, special characters in labels, and excessively long text that might break diagram layouts. Building a robust generator requires understanding Mermaid's syntax rules and escaping requirements.
Best Practice: Create a dedicated utility module for diagram generation functions. This separation of concerns keeps your components focused on rendering while centralizing the logic for translating data into diagram syntax. Unit testing these generators becomes straightforward since they're pure functions with string outputs.
For user journey visualization, you might generate sequence diagrams from analytics event data, showing how users actually navigate through your application. For system architecture views, generating diagrams from service registry data ensures documentation stays synchronized with deployments. The possibilities expand dramatically when you treat diagram definitions as computed values rather than static strings.
Implementing Real-Time Diagram Updates
SaaS dashboards increasingly demand real-time capabilities, and diagrams should participate in this live experience. When subscription states change, user counts update, or system health metrics shift, diagrams reflecting this information should update without requiring page refreshes.
The technical approach depends on your real-time infrastructure. Applications using WebSocket connections can push diagram updates when underlying data changes. Those leveraging server-sent events or polling mechanisms can trigger re-renders at appropriate intervals. The key consideration is balancing update frequency against rendering performance, as excessive re-renders can degrade user experience.
Implementing optimistic updates for diagram changes improves perceived responsiveness. When an administrator modifies a workflow that affects a displayed diagram, immediately updating the visualization while the backend processes the change creates a snappy, modern feel. Rollback mechanisms handle cases where backend operations fail, reverting the diagram to its previous state with appropriate error messaging.
For high-frequency data like active user counts or real-time metrics, consider debouncing diagram updates to prevent rendering thrash. Accumulating changes over short intervals (100-500 milliseconds) before triggering a single re-render maintains visual stability while keeping information reasonably current. The specific debounce timing depends on your use case and user expectations.
State management integration ensures diagram components receive updates through your application's standard data flow patterns. Whether using React Context, Redux, Zustand, or another state management solution, diagram components should subscribe to relevant state slices and re-render when dependencies change. This approach maintains consistency with how other dashboard components handle real-time data.
Theming and Visual Customization
Professional SaaS applications maintain consistent visual design across all interface elements, and diagrams should be no exception. Mermaid's theming system provides extensive customization options, though achieving seamless integration with your design system requires careful configuration.
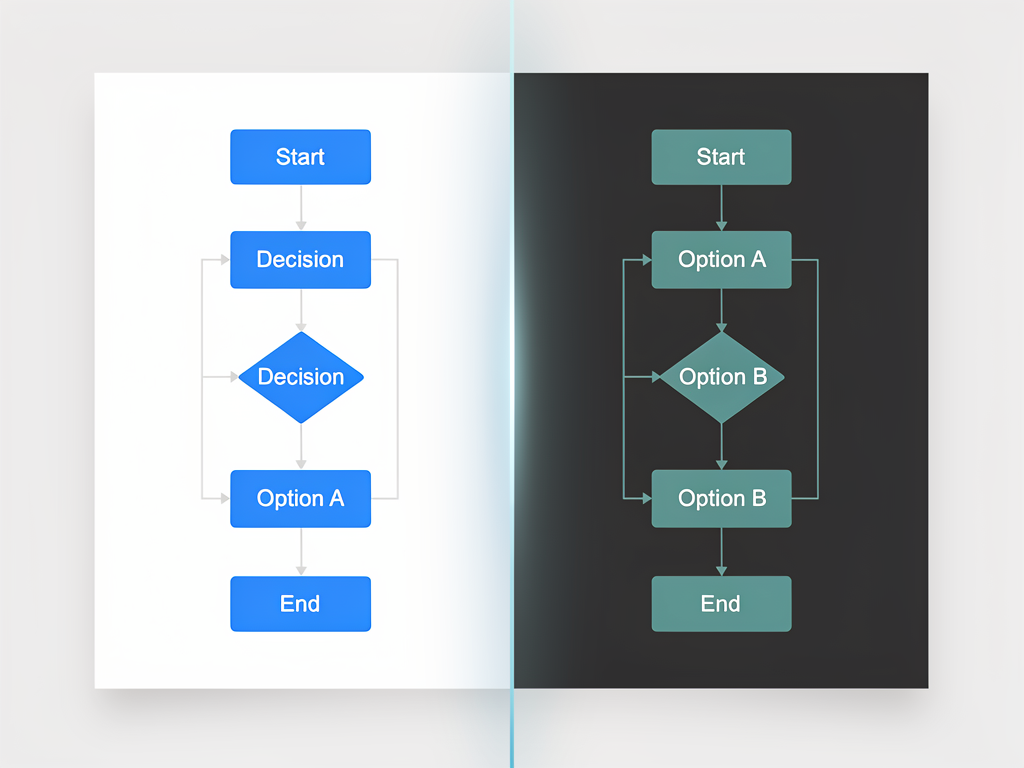
The library ships with several built-in themes: default (neutral grays), dark (suitable for dark mode interfaces), forest (green-tinted), and neutral (minimal styling). For most SaaS applications, these themes serve as starting points rather than final solutions. Custom theming allows you to match your brand colors, typography, and visual style precisely.
Theme customization happens through CSS variables and initialization configuration. You can override colors for nodes, edges, text, and backgrounds at both global and diagram-specific levels. For applications supporting user-selectable themes or automatic dark mode detection, implementing dynamic theme switching ensures diagrams adapt alongside other interface elements.
| Theme Variable | Affects | Customization Example |
|---|---|---|
| primaryColor | Main node backgrounds | Match your brand's primary color |
| primaryTextColor | Text within primary nodes | Ensure sufficient contrast ratio |
| lineColor | Connecting lines and arrows | Slightly muted version of text color |
| secondaryColor | Secondary node backgrounds | Complementary or neutral shade |
| tertiaryColor | Tertiary elements and highlights | Accent color for emphasis |
Beyond colors, typography customization ensures diagram text matches your application's font choices. Specifying font family, size, and weight through configuration creates visual harmony. Be mindful that certain fonts render better at small sizes typical in complex diagrams, so testing with realistic content helps identify readability issues early.
For SaaS applications serving enterprise customers with white-labeling requirements, implementing tenant-specific theming for diagrams extends your customization capabilities. Storing theme configurations per tenant and applying them during Mermaid initialization enables each customer to see diagrams matching their branded experience.
Performance Optimization Strategies
Dashboard performance directly impacts user satisfaction and productivity. While Mermaid renders diagrams efficiently, thoughtful optimization ensures diagrams enhance rather than hinder the overall experience, particularly on pages displaying multiple visualizations or handling large data sets.
Lazy loading represents the most impactful optimization for pages with diagrams below the initial viewport. Using intersection observer APIs or React's lazy loading capabilities, you can defer diagram rendering until users scroll them into view. This approach dramatically improves initial page load times, especially for dashboards with multiple diagram sections.
The Mermaid library itself can be code-split from your main bundle. Since many users may never visit pages containing diagrams, loading the library only when needed reduces initial JavaScript payload. Dynamic imports combined with loading states create a smooth experience where the library loads on demand without blocking other functionality.
Performance Tip: For complex diagrams with many nodes, consider implementing progressive rendering. Display a simplified overview initially, then render the full diagram when users indicate interest (through clicking, hovering, or explicit expansion). This pattern works particularly well for system architecture diagrams that can become visually overwhelming.
Caching rendered SVG output prevents redundant rendering when diagram definitions haven't changed. Implementing a cache keyed by definition hash allows instant display of previously rendered diagrams. For server-rendered applications, pre-rendering diagrams during build time or on first request eliminates client-side rendering entirely for static content.
Memory management becomes important in single-page applications where users navigate between views without full page reloads. Properly cleaning up Mermaid instances when components unmount prevents memory leaks. The cleanup process should remove event listeners, clear any internal state, and release references to rendered SVG elements.
Security Considerations for Dynamic Content
When diagram definitions come from user input, external APIs, or database content, security considerations become paramount. Mermaid's rendering process can potentially execute malicious content if not properly configured, making security-conscious implementation essential for production SaaS applications.
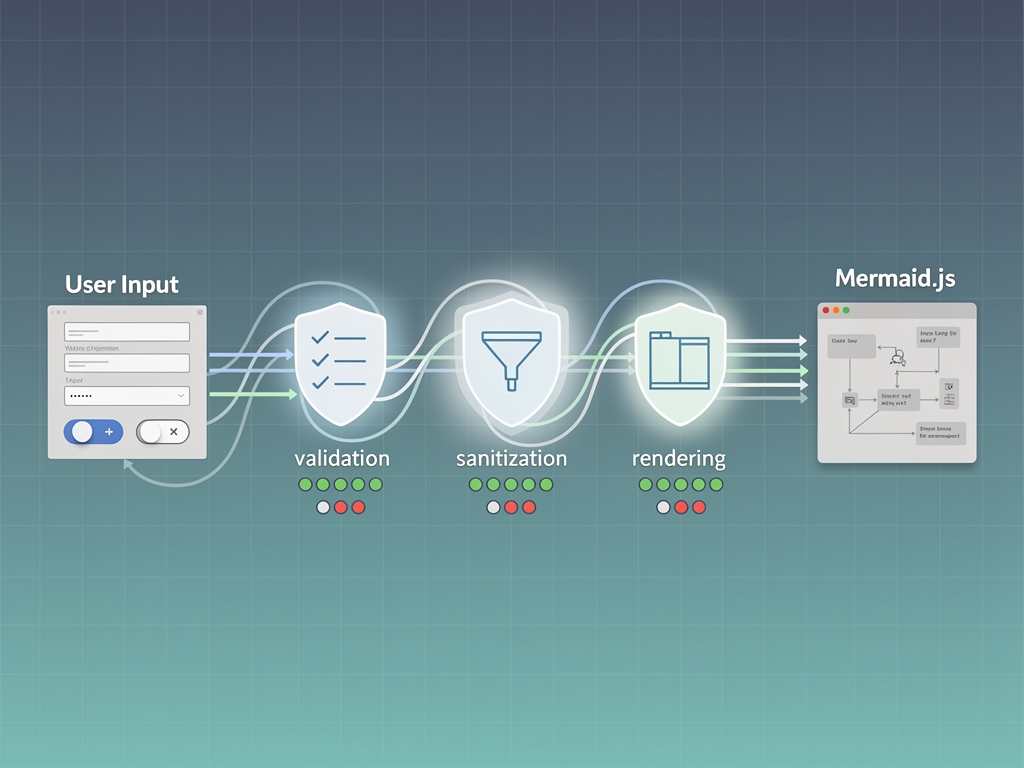
The securityLevel configuration option controls how Mermaid handles potentially dangerous content. Setting this to 'strict' prevents click handlers, JavaScript execution, and other potentially exploitable features. For diagrams generated from untrusted sources, strict mode should be non-negotiable, even though it limits some interactive capabilities.
Input sanitization before passing content to Mermaid provides defense in depth. Validating that diagram definitions conform to expected patterns, stripping unexpected characters, and limiting definition length all reduce attack surface. Regular expression validation can catch obvious injection attempts, though comprehensive sanitization requires understanding Mermaid's full syntax.
Content Security Policy (CSP) headers interact with Mermaid's rendering in important ways. Since Mermaid generates inline SVG content, your CSP must allow inline SVG or use nonces for generated content. Testing your CSP configuration with Mermaid rendering ensures diagrams display correctly in production environments with strict security headers.
For multi-tenant SaaS applications, isolating diagram rendering between tenants prevents cross-tenant information leakage. Ensuring that one tenant's diagram definitions cannot reference or affect another tenant's content requires careful scoping of identifiers and rendering contexts.
Advanced Use Cases for SaaS Platforms
Beyond basic visualization, creative applications of dynamic diagramming can differentiate your SaaS product and provide unique value to users. Exploring these advanced use cases may inspire features that set your application apart from competitors.
Interactive Workflow Builders
Combining Mermaid visualization with drag-and-drop workflow builders creates powerful automation interfaces. Users construct workflows through intuitive interactions while seeing real-time diagram previews of their creations. The diagram serves both as feedback during construction and documentation for completed workflows.
Automated Documentation Generation
For developer-focused SaaS products, automatically generating architecture diagrams from code analysis, API specifications, or infrastructure configurations provides immense value. Users receive always-current documentation without manual maintenance effort. This approach particularly benefits platforms where understanding system relationships is crucial for effective usage.
Onboarding Progress Visualization
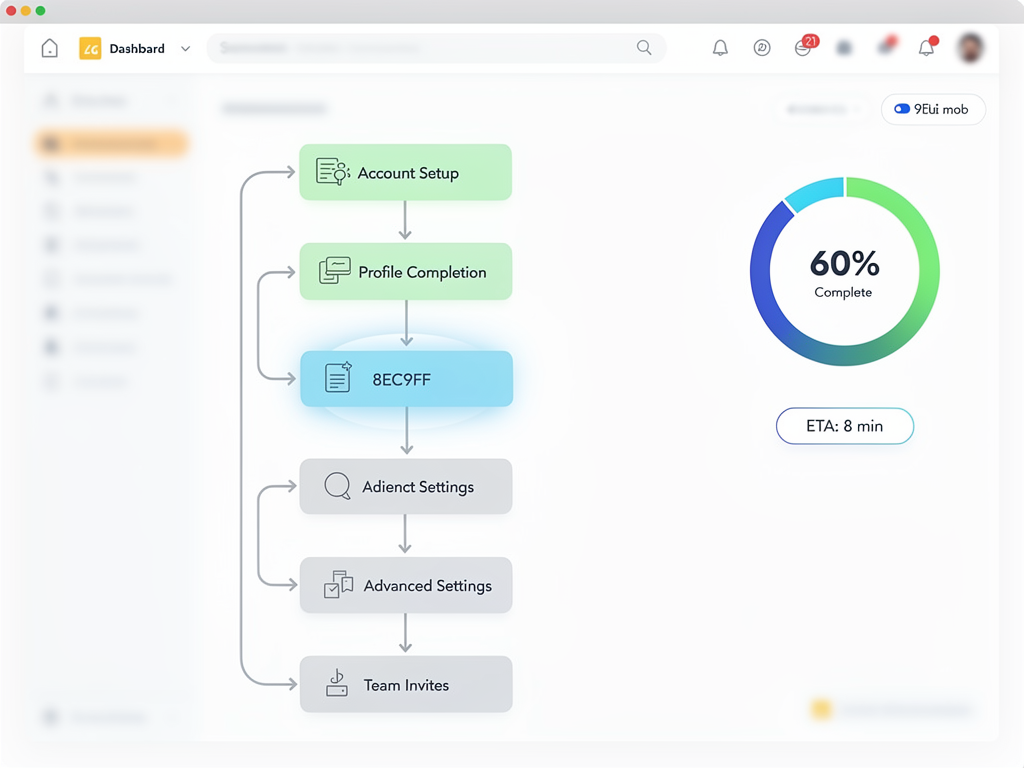
Displaying user onboarding progress as a flowchart or state diagram helps new users understand where they are in the setup process and what steps remain. This visual approach often proves more effective than traditional progress bars or checklists, particularly for complex onboarding sequences with conditional paths.
Dependency and Impact Analysis
For SaaS platforms managing complex configurations, visualizing dependencies helps users understand the impact of changes before making them. Showing which features, integrations, or users would be affected by modifying a particular setting prevents accidental disruptions and builds user confidence.
Audit Trail Visualization
Transforming audit log data into sequence diagrams provides intuitive understanding of what happened, when, and in what order. For compliance-focused applications, this visualization capability helps administrators investigate incidents and demonstrate proper controls to auditors.
Integration with No-Code Platform Builders
The intersection of diagram visualization and no-code platform development presents exciting opportunities. If you're building tools that enable others to create applications without coding, diagram capabilities can significantly enhance the user experience and platform capabilities.
Platforms like NextBuilder demonstrate how no-code SaaS builders can leverage visual tools to help users understand their application structures. When users create data models, workflows, or page hierarchies through no-code interfaces, automatically generating diagrams from these structures provides valuable feedback and documentation.
For SaaS boilerplate implementations that include visual builders or configuration interfaces, integrating Mermaid rendering creates a feedback loop where users see the results of their configurations visualized in real time. This immediate feedback accelerates learning and reduces configuration errors.
The combination of text-based diagram definitions with no-code interfaces also enables interesting hybrid approaches. Power users can edit diagram definitions directly for precise control, while casual users interact through graphical interfaces that generate definitions behind the scenes. This flexibility accommodates diverse user skill levels within a single platform.
Testing and Quality Assurance
Ensuring diagram rendering works correctly across browsers, devices, and data scenarios requires thoughtful testing strategies. Unlike typical UI components, diagrams present unique testing challenges due to their dynamic, generated nature.
Unit testing diagram generator functions verifies that your data-to-syntax transformation logic produces valid Mermaid definitions. These tests should cover edge cases like empty data, special characters, extremely long labels, and unusual data structures. Since generators are pure functions, testing them in isolation is straightforward and fast.
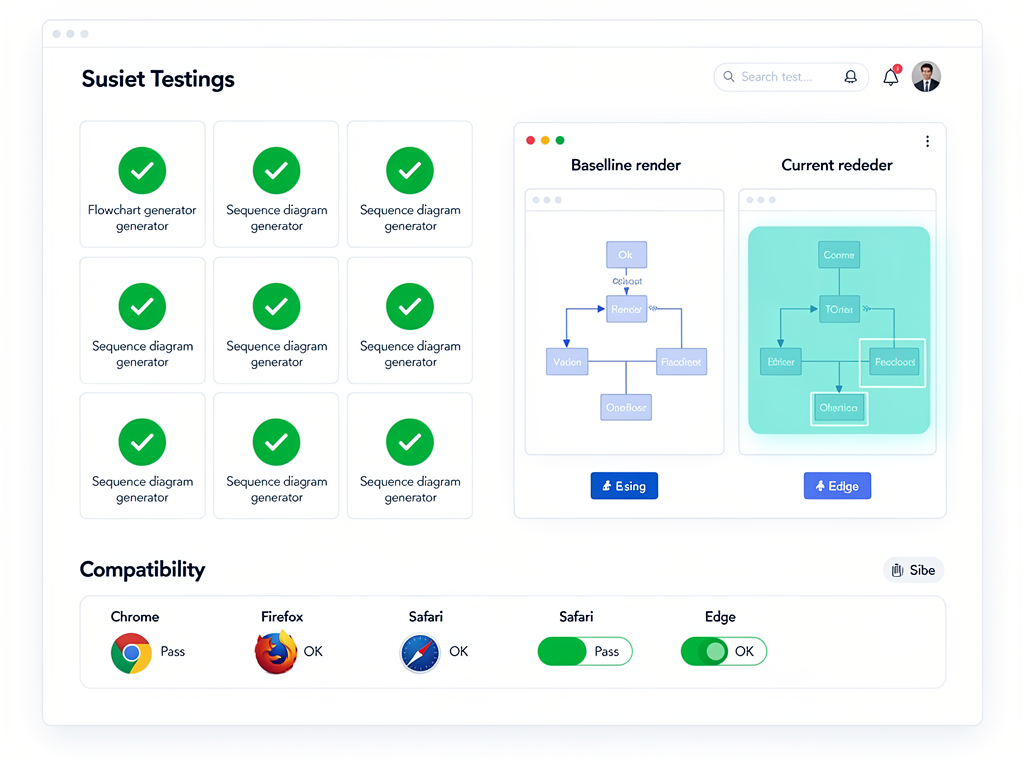
Visual regression testing catches rendering differences that might not appear in unit tests. Tools like Percy, Chromatic, or custom screenshot comparison workflows can detect when diagram appearance changes unexpectedly. Establishing baseline screenshots for key diagram types and comparing against them during CI/CD pipelines prevents visual regressions from reaching production.
Integration testing verifies that diagrams render correctly within your actual application context. Testing the full flow from data fetching through rendering ensures that all pieces work together correctly. These tests should exercise real Mermaid rendering rather than mocking the library, catching issues that only appear during actual rendering.
Cross-browser testing remains important since SVG rendering can vary between browsers. While modern browsers generally handle SVG consistently, edge cases in complex diagrams may render differently. Testing on Chrome, Firefox, Safari, and Edge (at minimum) ensures broad compatibility for your user base.
Monitoring and Analytics for Diagram Usage
Understanding how users interact with diagrams in your application informs optimization efforts and feature development. Implementing appropriate monitoring and analytics provides visibility into diagram performance and usage patterns.
Tracking rendering performance metrics helps identify problematic diagrams or pages. Measuring time from component mount to successful render, capturing rendering failures, and monitoring memory usage during rendering all provide actionable insights. Setting up alerts for degraded performance enables proactive response before users complain.
Usage analytics reveal which diagram types and features users find most valuable. Tracking which diagrams users view, how long they spend examining them, and whether they interact with them (zooming, panning, clicking) guides product decisions. If certain diagram types see minimal usage, you might simplify the interface by removing them or investigate why they're not providing value.
Error tracking specifically for diagram rendering helps identify issues that might otherwise go unnoticed. Users often don't report rendering failures, assuming the problem is on their end. Proactive error monitoring ensures you learn about issues quickly and can address them before they affect many users.
For Next.js SaaS template implementations, integrating diagram analytics with your existing analytics infrastructure maintains consistency in how you measure and analyze user behavior across your application.
Future-Proofing Your Diagram Implementation
The diagramming landscape continues evolving, with new capabilities, competing libraries, and changing best practices. Building your implementation with future flexibility in mind reduces the cost of adapting to changes.
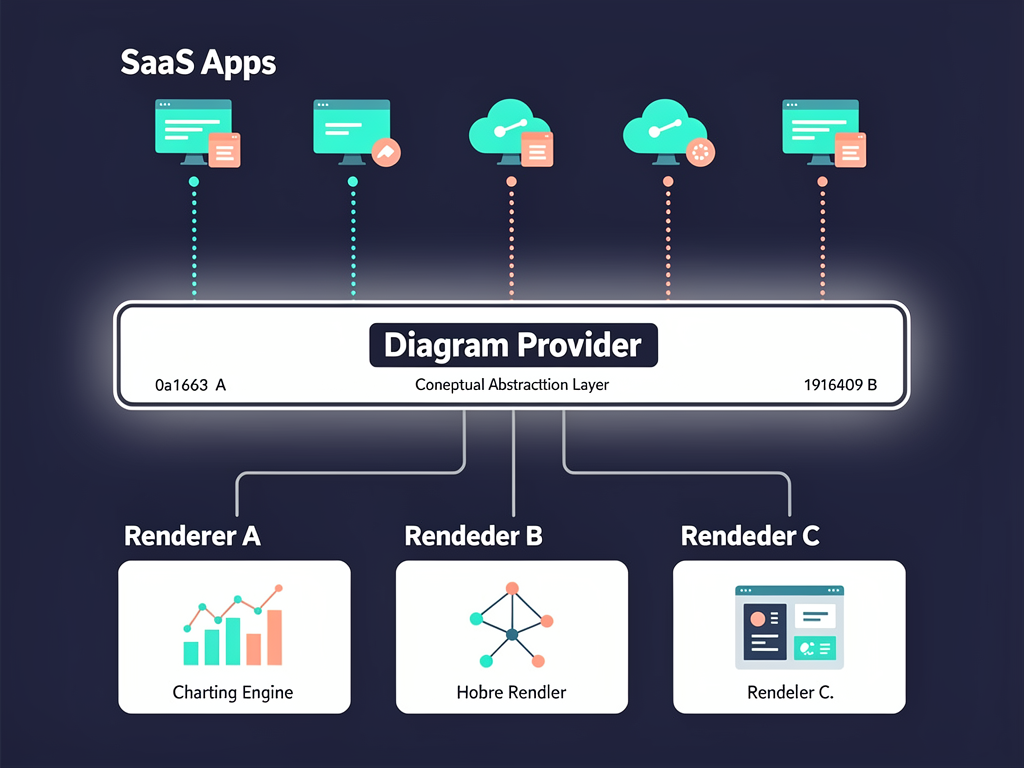
Abstracting Mermaid behind your own component interface isolates the library choice from consuming code. If you later decide to switch libraries or implement custom rendering, only the abstraction layer needs updating. This pattern also simplifies testing by enabling mock implementations during unit tests.
Staying current with Mermaid releases ensures access to new diagram types, performance improvements, and security patches. Establishing a regular update cadence, perhaps quarterly, balances stability with currency. Reading release notes before updating helps identify breaking changes that might affect your implementation.
Monitoring the broader ecosystem for emerging alternatives keeps you informed about potentially superior options. While Mermaid currently leads in text-based diagramming, the JavaScript visualization space evolves rapidly. Being aware of alternatives like D3.js for custom visualizations or specialized libraries for specific diagram types ensures you can make informed decisions about your technology choices.
Practical Implementation Checklist
Before deploying diagrams to production, working through a comprehensive checklist ensures you've addressed all critical considerations. This systematic approach prevents common oversights that could cause issues after launch.
- Client-side rendering verified: Confirm diagrams only render on the client to prevent SSR errors
- Security configuration reviewed: Ensure appropriate security level for your content sources
- Theme integration complete: Verify diagrams match your design system in all theme modes
- Error handling implemented: Confirm graceful degradation when rendering fails
- Performance optimized: Implement lazy loading, caching, and code splitting as appropriate
- Accessibility considered: Provide alternative text descriptions for screen reader users
- Testing coverage adequate: Include unit, integration, and visual regression tests
- Monitoring configured: Set up performance and error tracking for diagram rendering
- Documentation updated: Document diagram components for team members
- Browser compatibility verified: Test across your supported browser matrix
Conclusion
Adding dynamic diagrams to your SaaS admin dashboard transforms how users understand and interact with complex information. The text-based approach offered by Mermaid provides a maintainable, version-controllable, and dynamically generatable solution that fits naturally into modern development workflows. From visualizing subscription flows and user journeys to documenting system architectures and displaying real-time data relationships, the applications span virtually every SaaS domain.
Success with diagram integration requires attention to several key areas: proper client-side rendering setup, thoughtful security configuration, seamless theme integration, and performance optimization. By building reusable components, implementing dynamic generation from application data, and establishing comprehensive testing practices, you create a foundation that serves your application's visualization needs as it grows and evolves.
The investment in diagram capabilities pays dividends through improved user understanding, reduced support burden, and differentiated product experience. Whether you're building on an existing SaaS template or starting fresh, integrating powerful visualization tools positions your application to meet the expectations of modern users who demand more than static, text-heavy interfaces.
Frequently Asked Questions
Can Mermaid Diagrams Be Made Interactive with Click Handlers?
Yes, Mermaid supports click handlers that can trigger JavaScript functions when users click on diagram nodes. However, this functionality requires careful security consideration. When the security level is set to 'strict' (recommended for any content from untrusted sources), click handlers are disabled to prevent potential XSS attacks. For trusted, developer-defined diagrams, you can enable click handlers by using 'loose' security mode and defining callback functions in your initialization configuration. The callbacks receive the clicked node's ID, allowing you to implement navigation, modal displays, or other interactive behaviors. Many SaaS applications use this capability to create clickable architecture diagrams that navigate to relevant detail pages or expand additional information panels.
How Do I Handle Very Large or Complex Diagrams That Become Unreadable?
Large diagrams present both rendering performance and readability challenges. Several strategies address this effectively. First, implement diagram pagination or hierarchical drilling, showing high-level overviews with the ability to expand sections for detail. Second, use Mermaid's subgraph feature to group related nodes, creating visual organization that aids comprehension. Third, consider implementing pan and zoom controls using libraries like panzoom.js wrapped around your rendered SVG, allowing users to navigate large diagrams comfortably. Fourth, for extremely complex visualizations, evaluate whether a different diagram type or multiple simpler diagrams might communicate the information more effectively. Finally, responsive design considerations may require showing simplified mobile versions with full diagrams available on larger screens.
What's the Best Approach for Storing Diagram Definitions in a Database?
Storing diagram definitions as text strings in your database works well for most use cases. Use a TEXT or VARCHAR column with sufficient length for your expected diagram complexity. For applications where users create or modify diagrams, store both the current definition and a version history to enable rollback. Consider implementing validation before storage to catch syntax errors early rather than during rendering. For performance-critical applications, you might also cache rendered SVG output alongside definitions, regenerating only when definitions change. If diagrams reference dynamic data, store the template with placeholder tokens rather than fully resolved definitions, generating the final syntax at render time by substituting current values.
How Can I Export Diagrams as Images for Reports or Documentation?
Mermaid renders diagrams as SVG elements, which can be exported through several methods. For client-side export, you can serialize the SVG element to a string and trigger a download, or use libraries like html-to-image or dom-to-image to convert the SVG to PNG or JPEG formats. For server-side export (useful for automated report generation), tools like Puppeteer can render pages containing Mermaid diagrams and capture screenshots. The Mermaid CLI tool also supports direct conversion from definition files to image outputs, useful for CI/CD pipelines generating documentation. When exporting, ensure your theme configuration produces appropriate colors for the export context, as diagrams optimized for dark mode dashboards may not print well on white paper.
Does Mermaid Support Accessibility Features for Screen Reader Users?
Mermaid's SVG output includes some basic accessibility features, but comprehensive accessibility requires additional implementation effort. The rendered SVG can include title and description elements that screen readers announce, though you must configure these through Mermaid's accessibility options. For complex diagrams, consider providing alternative text descriptions that convey the same information in prose form, as screen readers cannot effectively communicate visual relationships between nodes. Implementing keyboard navigation for interactive diagrams ensures users who cannot use a mouse can still interact with clickable elements. ARIA attributes can be added to the containing elements to provide context about the diagram's purpose. Testing with actual screen readers (NVDA, JAWS, VoiceOver) reveals accessibility gaps that automated testing might miss.
Can I Use Mermaid with Server-Side Rendering Frameworks?
While Mermaid requires browser APIs for rendering, you can still use it effectively in SSR frameworks like Next.js with proper implementation. The key is ensuring Mermaid code only executes on the client side. In Next.js, use dynamic imports with the ssr: false option to load your diagram component only on the client. Alternatively, wrap Mermaid initialization and rendering in useEffect hooks that only run after hydration. For truly server-rendered diagrams (useful for SEO or email embedding), you can use Mermaid's CLI or a headless browser on the server to pre-render diagrams as static SVG or images, then serve these pre-rendered assets. This approach trades real-time dynamism for improved initial load performance and broader compatibility with contexts where JavaScript execution isn't available.
Ready to Build Your SaaS Dashboard with Dynamic Diagrams?
Implementing powerful visualization capabilities becomes significantly easier when you start with a solid foundation. SaasCore provides a comprehensive Next.js boilerplate with admin dashboards, authentication, subscription management, and all the infrastructure you need to focus on building features like dynamic diagrams rather than reinventing basic SaaS functionality. Explore the demo to see how a well-architected SaaS template accelerates your development timeline from months to days.
Subscribe to our newsletter
Subscribe to our newsletter and stay up-to-date with the latest news and updates.